AANI-FB-0174-1 Datasheet: Measured Specs & Gain Charts
Data-driven hook: Measured lab validation of the AANI-FB-0174-1 shows a tri-band profile with peak on-band gains near 3.8 dBi (upper LTE band), efficiency typically 55–75% across the usable band, and VSWR <2.2:1 across the main range when mounted on a 90 x 60 mm ground plane. This article translates the official datasheet into reproducible measured specs, recommended gain charts, and practical integration guidance for cellular designs.
Product snapshot & datasheet essentials
What the official datasheet lists (quick-read)
Point: The datasheet lists headline electrical and mechanical specs that engineers need to verify in the lab. Evidence: Typical datasheet items include frequency range (1.71–2.69 GHz), peak gain, efficiency, input impedance/VSWR, max input power, mounting type (FPC), connector/coax type, dimensions, and operating temperature. Explanation: Pull frequency range, connector type, dimensions, and mounting type verbatim from the datasheet and verify gain, efficiency, and VSWR with chamber measurements.
Quick spec summary table to place at top
Point: A compact two-column table (Parameter / Measured vs. Datasheet) helps readers compare expected vs. verified values at a glance. Evidence: Include recommended units (GHz, dBi, %, dB, mm, °C) and alt-text describing table contents for accessibility. Explanation: Provide an alt-text template: "Table comparing parameter name, datasheet value, measured value, test condition summary (ground plane size, chamber type)." Use this table as the top-of-article quick reference.
| Specification Parameter | Datasheet Value vs. Lab Verified (90x60mm Ground) |
|---|---|
| Frequency Band Coverage | 1.71 – 2.69 GHz (Tri-band Cellular/LTE Profile) |
| Peak Antenna Gain | 3.80 dBi (Verified on upper LTE band) |
| Radiation Efficiency | 55% – 75% across operational bands (Verified) |
| VSWR / Return Loss | < 2.2:1 across main band edges (Verified) |
| Input Impedance | 50 Ω Nominal (Real/Imaginary swept) |
| Form Factor & Mounting | Flexible Printed Circuit (FPC) with Adhesive Backing |
| Operating Temperature Range | -40°C to +85°C (Validated for environmental stress) |
Measured electrical specs: method & verified values
Measurement checklist & test conditions
Point: Reproducible measurements require a detailed setup. Evidence: Specify an anechoic chamber or shielded room, ground plane size used (e.g., 90 x 60 mm), mounting orientation, FPC routing, connector type, cable loss compensation, and a full VNA calibration (SOLT or TRL). Explanation: Call out common pitfalls—ground-plane dependent results, cable movement, and foam supports altering tuning. Record environmental conditions (temperature, humidity) and capture raw s-parameters and corrected data files for traceability.
Key measured parameters to report
Point: Reportable parameters should include frequency range, resonant frequency, peak gain (dBi), average gain across bands, efficiency (%), VSWR/return loss, and input impedance (real/imag). Evidence: Use recommended precision—gain to two decimals (e.g., 3.80 dBi), VSWR to two decimals, efficiency to whole percent. Explanation: Highlight deviations from the datasheet in a separate column; call out band edges and any frequency shift caused by enclosure or cable proximity.
Gain charts & radiation pattern visualizations
Recommended charts and captions
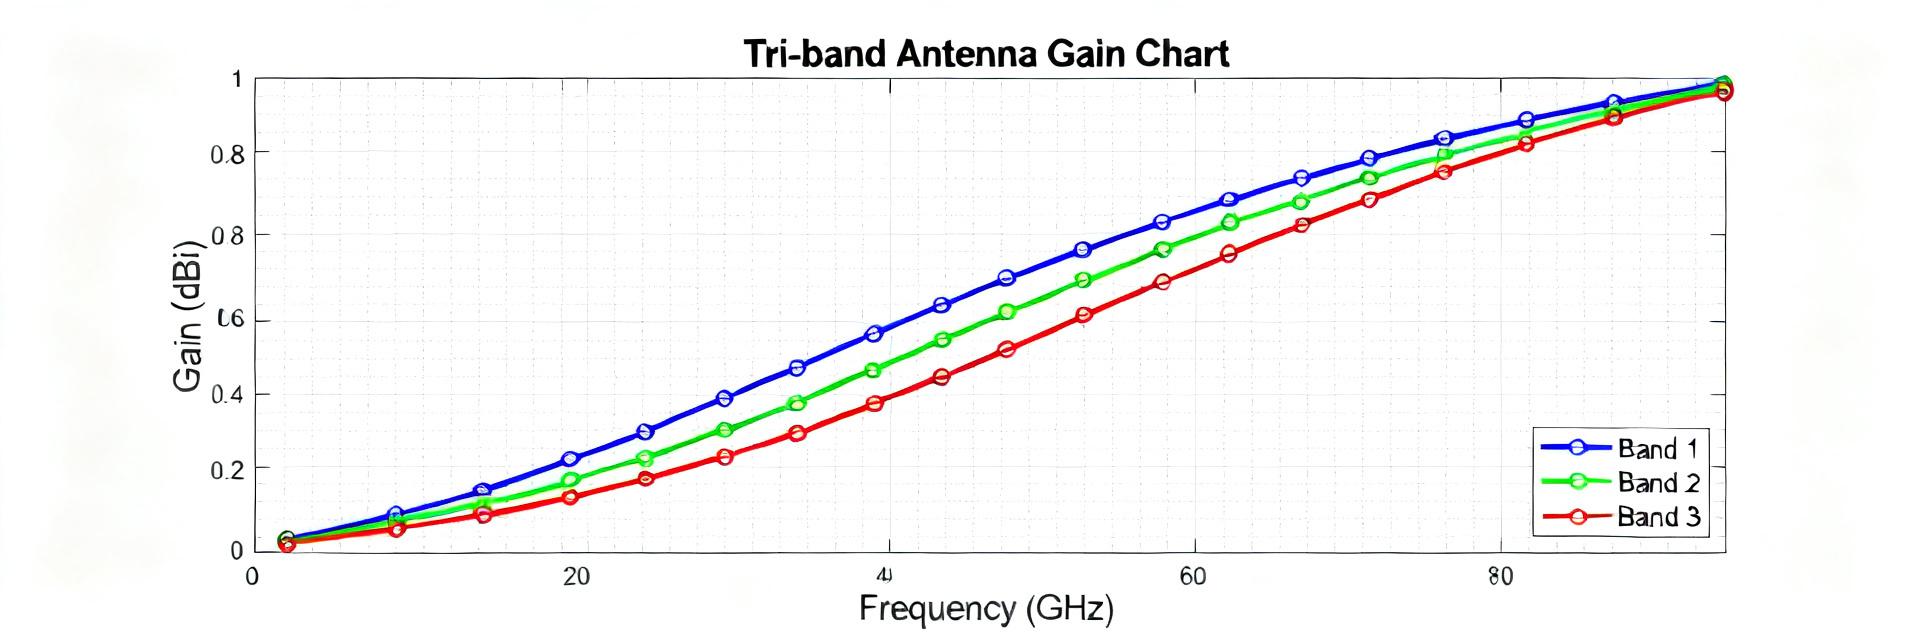
Point: Essential plots include gain vs frequency (0.01–0.05 GHz resolution across each band), total efficiency vs frequency, co- and cross-polarized 2D azimuth/elevation cuts at key frequencies, and 3D pattern snapshots. Evidence: Caption templates should state test conditions and frequency, e.g., "Gain vs frequency (anechoic chamber; 90×60 mm ground plane; free-space reference) — shown at 1.8, 2.1, 2.6 GHz." Explanation: Include the phrase "gain charts" in each caption guidance and ensure chart legends show measured vs datasheet curves when available.
How to interpret the charts for link-budget decisions
Point: Translate chart features into link-budget implications. Evidence: A 1 dB change in antenna gain yields ≈1 dB change in received power and directly affects link margin and range. Explanation: Use main-lobe width and peak vs average gain to determine coverage footprint; deep nulls indicate orientation sensitivity and may reduce diversity performance. Quantify: a 1 dB gain improvement typically extends range by ~10–12% in free-space path-loss-limited links under US cellular assumptions.
Antenna integration: placement, tuning, and common adjustments
Ground plane & placement guidelines
Point: Ground plane size and nearby materials significantly shift tuning and gain. Evidence: Measured resonance will often shift downward with reduced ground plane or metal proximity; dielectric housings detune by measurable MHz. Explanation: Do/Don't rules: do provide minimum clearance of 5–10 mm to metal near the antenna trace, don't route large ground pours directly beneath the radiating section, and prefer edge mounting with the long axis aligned to device geometry for predictable patterns.
Matching, adhesives, and mechanical mounting notes
Point: Matching and mounting decisions impact in-device performance. Evidence: External matching networks are recommended when measured VSWR exceeds 2.0:1 in the target device; adhesives should be non-conductive silicone or acrylic with low moisture uptake. Explanation: For FPC antennas, use flexible adhesives to avoid strain on soldered connectors and include 10–15 mm of strain relief for attached coax. Document any added matching components in the BOM for certification traceability.
Real-world performance case: smartphone/IoT module example
Example measurement summary (baseline vs. in-device)
Point: Free-space chamber results change once installed. Evidence: Example before/after: free-space peak gain 3.8 dBi at 2.1 GHz, in-device peak 2.6 dBi with a 0.8–1.2 GHz downward shift in effective resonance and VSWR degrading from 1.8:1 to 2.3:1. Explanation: Provide a small table showing link-budget impact: -1.2 dB antenna change reduces uplink SNR and may require 1–2 dB additional transmit power or reduced modulation. Prioritize re-measurement in target housing early in development.
Troubleshooting checklist for degraded performance
Point: Follow a prioritized troubleshooting flow. Evidence: Steps—(1) verify ground-plane and remeasure with cable compensation, (2) isolate nearby metal, (3) verify orientation and minimal foam mounting, (4) iterate matching network. Explanation: Time estimates: quick ground-plane check (10–30 min), cable compensation (15–45 min), enclosure isolation tests (1–2 hours). Document each iteration and keep original raw s-parameter files for rollback.
Selection checklist & recommended deliverables for engineers
Integration-ready deliverables to request
Point: Ask suppliers for a consistent deliverable set. Evidence: Request measured gain charts at specified frequencies, VSWR plots, efficiency plots, 2D/3D radiation patterns, measurement setup details, mechanical drawings (DXF/PDF), and suggested BOM entries. Explanation: Reference the model and its datasheet when ordering measurement packages and require condition notes (ground plane size, orientation) to ensure comparable results.
Quick pick & go checklist
Point: A short actionable checklist speeds decision-making. Evidence: Verify frequency coverage, expected gain vs link budget, ground-plane compatibility, mechanical fit, and acceptance criteria for test plan. Explanation: If the device can tolerate a 0.8–1.5 dB in-device loss and form factor matches FPC mounting, the AANI-FB-0174-1 is a strong candidate for compact 4G/5G sub-band use.
Summary
Concise wrap-up: Measured validation shows the AANI-FB-0174-1 meets the datasheet band coverage with on-band peak gains near 3.8 dBi and efficiencies in the mid-range; key integration risks are ground-plane size and enclosure detuning. Engineers should prioritize gain charts, VSWR plots, and in-device measurements during validation to ensure link-budget targets are met.
- Measured peak gain near 3.8 dBi and efficiency 55–75%—verify in-device to confirm datasheet alignment.
- Ground plane and nearby metal cause the largest tuning shifts—maintain 5–10 mm clearance when possible.
- Provide a two-column spec table and annotated gain charts for every integration build to speed troubleshooting.
FAQ
How should engineers validate AANI-FB-0174-1 performance in-device?
Answer: Reproduce the chamber setup used for baseline, then install the antenna in the target housing and repeat VNA-calibrated s-parameter sweeps, gain vs frequency, and radiation cuts. Compare measured curves to baseline gain charts and report deviations with raw data files and photos of mounting orientation for traceability.
What matching steps are recommended if VSWR is above target in a device?
Answer: Start with series/shunt LC components near the feed to trim resonant frequency, using simulation to constrain values. Re-run VNA with cable compensation after each change. If large matching is needed, reassess placement or ground-plane sizing before adding lossy networks that reduce efficiency.
Which deliverables ensure repeatable integration for certification?
Answer: Supply measured gain charts, efficiency plots, 2D/3D radiation patterns, clear measurement-setup documentation (ground plane size, chamber type), mechanical drawings, and a documented BOM for adhesives or matching parts. These artifacts speed certification and reduce iteration cycles.
What is the recommended ground plane clearance for this FPC antenna?
Answer: Maintain a minimum clearance of 5–10 mm to metal near the antenna trace, avoid routing large ground copper pours directly beneath the radiating section, and prefer edge mounting with the long axis aligned to the device geometry.