PE51113-4 antenna: Detailed specs, gain & freq chart
The PE51113-4 antenna is a compact dual-band whip covering approximately 880–965 MHz and 1710–2170 MHz, with a nominal gain near 3 dBi and center points around 922.5 MHz and 1.94 GHz. This data-driven summary frames the article: full spec breakdown, plotting guidance for a gain chart across the frequency range, and practical installation and test steps tailored for US deployments.
Background & product snapshot (background introduction)

Quick technical snapshot (one-paragraph summary)
Point: At-a-glance published specs summarize capability and installation fit. Evidence: Published spec fields typically list frequency ranges 880–965 MHz and 1710–2170 MHz, center frequencies 922.5 MHz and 1.94 GHz, nominal gain ~3 dBi, VSWR ≈2:1, 50 Ω impedance, vertical polarization, straight/whip form factor, two bands, common SMA/SMA-male or similar connector, and compact dimensions. Explanation: Use this compact table for quick procurement and site-fit checks.
| Field | Published value |
|---|---|
| Frequency ranges | 880–965 MHz; 1710–2170 MHz |
| Center frequencies | 922.5 MHz; 1.94 GHz |
| Nominal gain | ~3 dBi |
| VSWR target | ≈2:1 (typical) |
| Impedance | 50 Ω |
| Polarization | Vertical |
| Antenna type | Whip / straight, 2-band |
| Connector / mounting | SMA-type or magnetic/base mount; verify variant |
| Weight / dims | Check published spec sheet for variant |
Why these specs matter for US networks
Point: Frequency planning and physical pattern drive real-world performance. Evidence: The listed frequency range covers legacy sub-GHz IoT/LTE bands and the 1700–2100 MHz mobile/AWS bands used in many US installations. Explanation: A ~3 dBi vertical whip gives moderate omnidirectional horizontal coverage and tight elevation pattern—suitable for gateways, backhaul segments, and small-cell feeders where vertical polarization and modest gain balance coverage versus size and wind load.
Technical specifications — fields explained (data analysis)
Electrical specs: impedance, VSWR, and efficiency
Point: Electrical metrics determine how much transmitted power becomes radiated signal. Evidence: Typical published impedance is 50 Ω and VSWR is listed ≈2:1 across each band; for a 2:1 VSWR the return loss is about 6.0 dB (RL = -20·log10((VSWR-1)/(VSWR+1))). Explanation: For a 2:1 VSWR, expected mismatch loss is roughly 0.5 dB, so system designers should budget that loss into link budgets. The PE51113-4 antenna can be treated as a ~3 dBi device, but measured efficiency and spectral variation should be checked during commissioning.
Mechanical & environmental specs: mounting, wind load, connectors
Point: Mechanical fit and outdoor rating affect longevity and performance. Evidence: Common whip variants ship with magnetic or fixed-base mounts and SMA-type connectors; cable loss increases with length (e.g., RG-316 vs LMR-400 differences). Explanation: Specify low-loss coax for runs >3–5 m, confirm connector gender and torque specs, and verify IP/wind ratings in the published datasheet before outdoor exposure. Label units and mounting clearances in purchase orders to avoid on-site surprises.
Gain & frequency chart — data, plotting & interpretation (data + charts)
Gain vs frequency: recommended chart & annotations
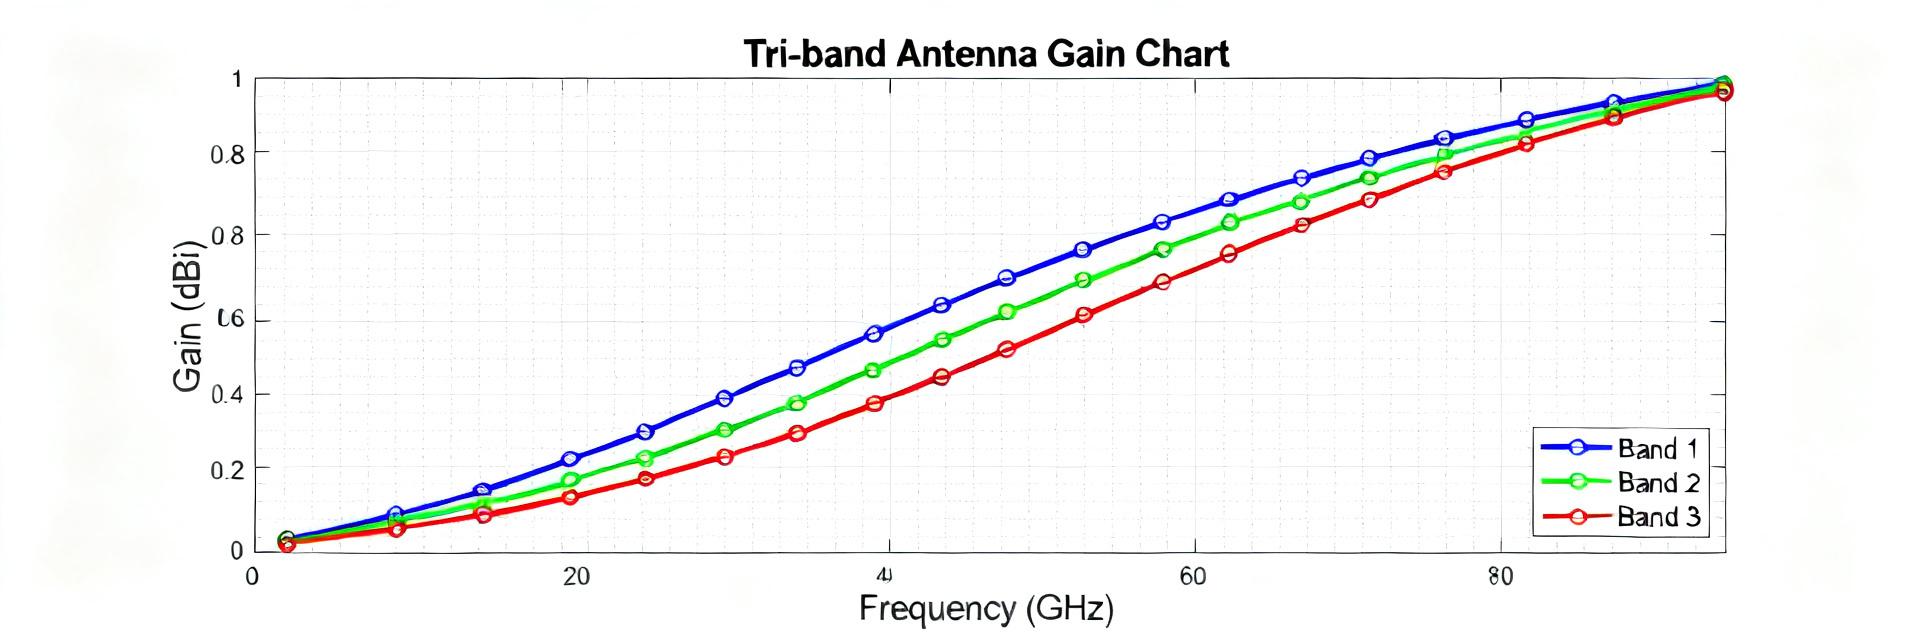
Point: A gain chart visualizes frequency-dependent behavior that the nominal 3 dBi hides. Evidence: Plot measured or supplier gain across 880–2170 MHz with X axis in MHz and Y axis in dBi, showing at least 8–12 points per band and a smoothed curve; annotate center points near 922.5 MHz and 1.94 GHz, mark band edges and any peaks/troughs. Explanation: The gain chart clarifies where gain rises or dips relative to the nominal value and guides tuning; include alt text like “Gain chart: PE51113-4 antenna, gain vs frequency (880–2170 MHz)”.
VSWR & impedance plots (companion chart)
Point: VSWR plots reveal usable bandwidth and mismatch hotspots. Evidence: Plot VSWR across the same frequency range and use Smith chart insets for critical bands; identify frequencies where VSWR exceeds the ≈2:1 target. Explanation: When VSWR spikes occur, corrective options include a matching network, changing feed cable, or slight mechanical repositioning. Use these plots to set pass/fail criteria for field acceptance.
Installation, tuning & testing guide (method/guideline)
Pre-install checklist & cable selection
Point: Proper planning minimizes unexpected loss and rework. Evidence: Measure cable runs; calculate feedline loss at center frequencies (feedline insertion loss increases with frequency); select LMR-200/240/400 equivalents depending on run length. Explanation: For runs under 3 m, an economical low-loss coax is acceptable; for longer runs use higher-spec cable. Verify connector type, torque values, grounding, and lightning protection before final mounting.
On-site tuning & verification (field test procedure)
Point: Field tests validate published specs and installation quality. Evidence: Sweep the antenna with a VNA to capture S11/VSWR, record gain/profile if available, and log RSSI/SINR from a known transmitter at multiple azimuth/elevation angles. Explanation: Pass criteria examples: VSWR ≤2:1 across target band or mismatch loss <1 dB; measured gain within ±2 dB of published nominal. Record test logs to support acceptance and troubleshooting.
Practical use cases, performance checklist & buying tips (case + action)
Typical deployment scenarios & expected performance
Point: Deployment context determines antenna suitability. Evidence: Small IoT gateway in suburban areas will see modest coverage radius with a 3 dBi whip; rooftop backhaul/booster feeders gain modest range extension but not deep coverage like high-gain panels. Explanation: Expect larger service radius under line-of-sight and reduced footprints in dense urban non-LOS. Use link-budget estimates (transmit power, cable loss, antenna gain) to predict real-world coverage.
Buying checklist & compatibility tips
Point: Procurement checks prevent field mismatches. Evidence: Confirm exact frequency bands needed, connector type, cable compatibility, availability of VSWR and gain chart data, and explicit environmental rating. Explanation: Ask vendors for measured gain tables vs. frequency range and VSWR plots; ensure FCC-compliant use for transmit applications and enforce grounding and surge protection on outdoor installs.
Summary
The PE51113-4 antenna is a compact dual-band whip spanning roughly 880–965 MHz and 1710–2170 MHz with a nominal 3 dBi gain. Use the gain chart and companion VSWR plots to validate on-site performance, follow the installation and testing checklist to control feedline and connector losses, and confirm cable/connector compatibility and environmental ratings before purchasing.
Key summary
- Dual-band coverage: Published frequency ranges cover ~880–965 MHz and 1710–2170 MHz; verify measured band edges against your planned allocations and regulatory needs.
- Nominal performance: Expect ~3 dBi nominal gain but consult a detailed gain chart to see frequency-dependent peaks and troughs when planning link budgets.
- Field verification: Use VNA sweeps for VSWR and S11, log RSSI/SINR at multiple bearings, and accept installations that meet VSWR ≤2:1 or mismatch loss targets.
FAQ
What is the usable frequency range for the PE51113-4 antenna?
The usable published frequency range spans roughly 880–965 MHz and 1710–2170 MHz. Confirm with vendor-provided VSWR and gain charts for the specific part number and verify measured performance on-site to account for mounting and nearby structures.
How should I interpret the gain chart for installation planning?
The gain chart shows dBi versus frequency and reveals where gain deviates from the nominal 3 dBi. Use at least 8–12 data points per band, annotate center frequencies, and incorporate measured variations into link-budget calculations and expected coverage footprints.
What pass/fail criteria should I use during field testing?
Typical acceptance criteria are VSWR ≤2:1 across the target band or mismatch loss under about 1 dB, and measured gain within ±2 dB of the published nominal at center frequencies. Also verify RSSI/SINR thresholds for the intended service to confirm functional coverage.
What are the primary installation considerations for US network deployments?
Key considerations include matching the frequency bands (880-965 MHz / 1710-2170 MHz) with US carrier and industrial IoT networks, utilizing high-quality low-loss coaxial cabling (like LMR-240 or LMR-400) for runs exceeding 3 meters, and ensuring solid RF grounding to achieve the specified 3 dBi gain.